
Humanoid#
Viewer Performance Impact Benchmark
Abstract#
Viewer Performance Impact Benchmark This benchmark quantifies the performance impact of BraxViewer on Brax PPO training speed. We measure training throughput under three scenarios: pure training, viewer backend with rendering disabled, and full real-time visualization.
Methods#
Experimental Design#
We conduct a factorial experiment with three factors:
Environment Scale: 64, 256, and 1024 parallel environments
Viewer Configuration: No viewer, viewer disabled, and viewer enabled
Hardware: Multiple compute devices are tested
Training Settings#
All experiments use identical PPO hyperparameters:
Environment:
humanoidwithpositionalbackendTraining steps: 50,000
Episode length: 1,000
Learning rate: 3e-4
Entropy cost: 1e-3
Performance Metrics#
Primary metrics include:
Total training time (seconds) (Figure 1, top)
Training progress curves (steps vs. time) (Figure 1, bottom)
Results#
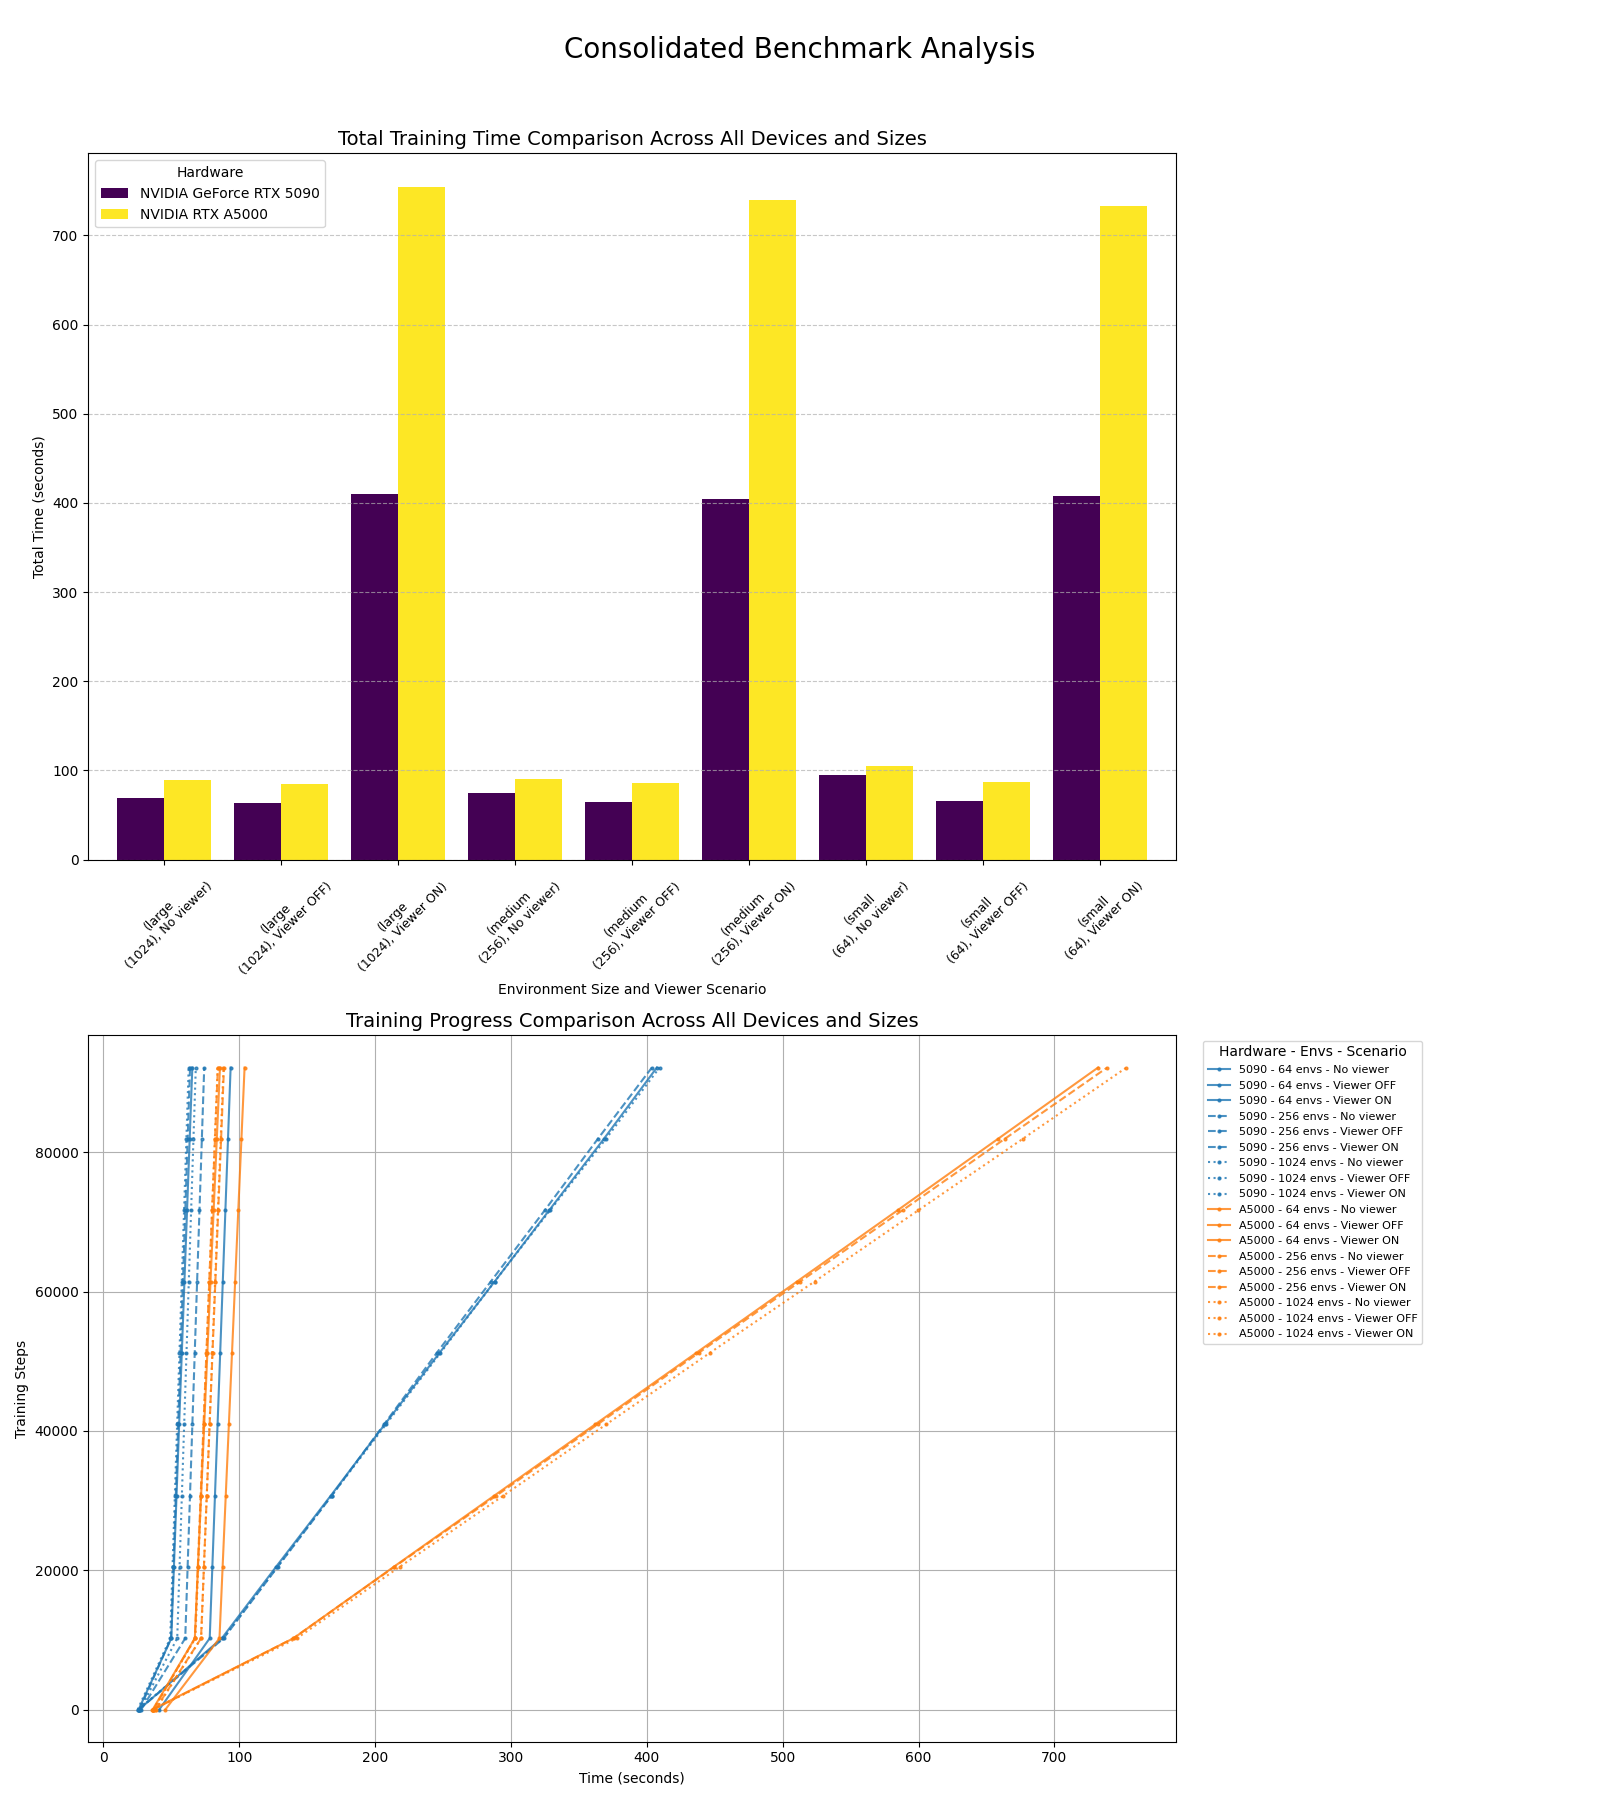
Figure 1: Total training time comparison (top) and training progress curves (bottom) across different hardware configurations, environment scales, and viewer scenarios.
Implementation#
The benchmark is implemented in benchmarks/brax/brax_envs/time_envs_device.ipynb. By running the notebook, the following files are generated.
report_{env_name}_{gpu_name}.json: Hardware specifications and timing resultsprogress_{env_name}_{gpu_name}.csv: Detailed training progress dataconsolidated_benchmark_comparison.png: Visual comparison of all runs